
Bangladesh is both an inspiring example of human development and a daunting challenge for engineers. Its extraordinary progress in reducing poverty has fuelled a surge in demand for energy. But without the necessary infrastructure, access to reliable and affordable power remains a major barrier to Bangladesh’s ambition.
Are Smart Grids a “smart” solution?
We sought to find out in a first-of-its-kind feasibility study financed by the German Development Bank in collaboration with Tractebel specialists from Germany and Romania. Power Systems Engineer, Luca Pizzimbone, tells his side of the story in this post.
Beginning with Khulna
Our study focused exclusively on Khulna and its surroundings in southwestern Bangladesh. The challenges facing this city exemplify those facing the entire country.
Alongside a 10 percent increase in demand for energy each year, Khulna residents experience high network losses, frequent outages, long repair times and inefficiencies due to their reliance on manual operation of the electrical networks.
With Smart Grids, Khulna could modernise its power system with digital technology. It has the potential to optimise the combination of bulk generation and storage, transmission, distribution and consumption while also reducing carbon emissions.
Analysing the distribution system
Software is essential to analyse electrical distribution systems for Smart Grids. It is how we assess the benefit of available technologies and optimise solutions against actual grid needs in present and future scenarios.
Simulations also enable virtual grid tests, including during stress events that are impossible to test in a real electrical system due to safety and operational concerns.
Running the software requires mathematical models to represent power system elements from transformers and overhead lines to generation and substations. In modern distribution systems, these mathematical models are already in use. Engineers need only to modify them according to the project needs.
In Khulna, however, the electrical distribution system was still operated manually. The SCADA system, software and mathematical models were unfortunately not available. In their absence, we needed to prepare these models from scratch.
Tremendous effort required
To give an idea of the tremendous effort required to build these models, consider that the electrical distribution system of West Bangladesh has more than 7,500 secondary substations and about 3,700 km of overhead lines.
Each one of these elements must be represented in the software by both mathematical models and schematic and geographic diagrams. Even more, each element must be entered manually in the system.
Given the large volume of documents, even a simple review of the data is tough. Constant communication with the client is required to identify which data and schemes are up-to-date, and which ones are no longer valid.
The winning strategy
Despite the odds, we succeeded to build the models required to complete the feasibility study. What was our winning strategy?
- Involving the distribution system operator in the preparation of the mathematical model.
- Providing training in the power system analysis software (PowerFactory).
- Working side-by-side with local engineers to build up the model and conduct the analysis.
Importantly, our consortium worked on different parts of the grid at the same time. We then prepared three different models, which we finally merged together using PowerFactory software.
Models in action
Wondering what these models look like? The geographic diagram below shows where the primary and secondary substations are located with GIS data. All the 33 kV and 11 kV overhead lines are routed to follow the road map in the background.
The schematic diagrams we created allowed for a more classic overview of the electrical distribution system.
How about voltage profiles? The blue colours in the diagram below show the areas with too low voltage (below 0.9 p.u.).
We built dedicated profiles for the blue areas, which we used to identify mitigating measures – such as optimal capacitor banks or new power supply – to stabilise the voltage within the permissible range.
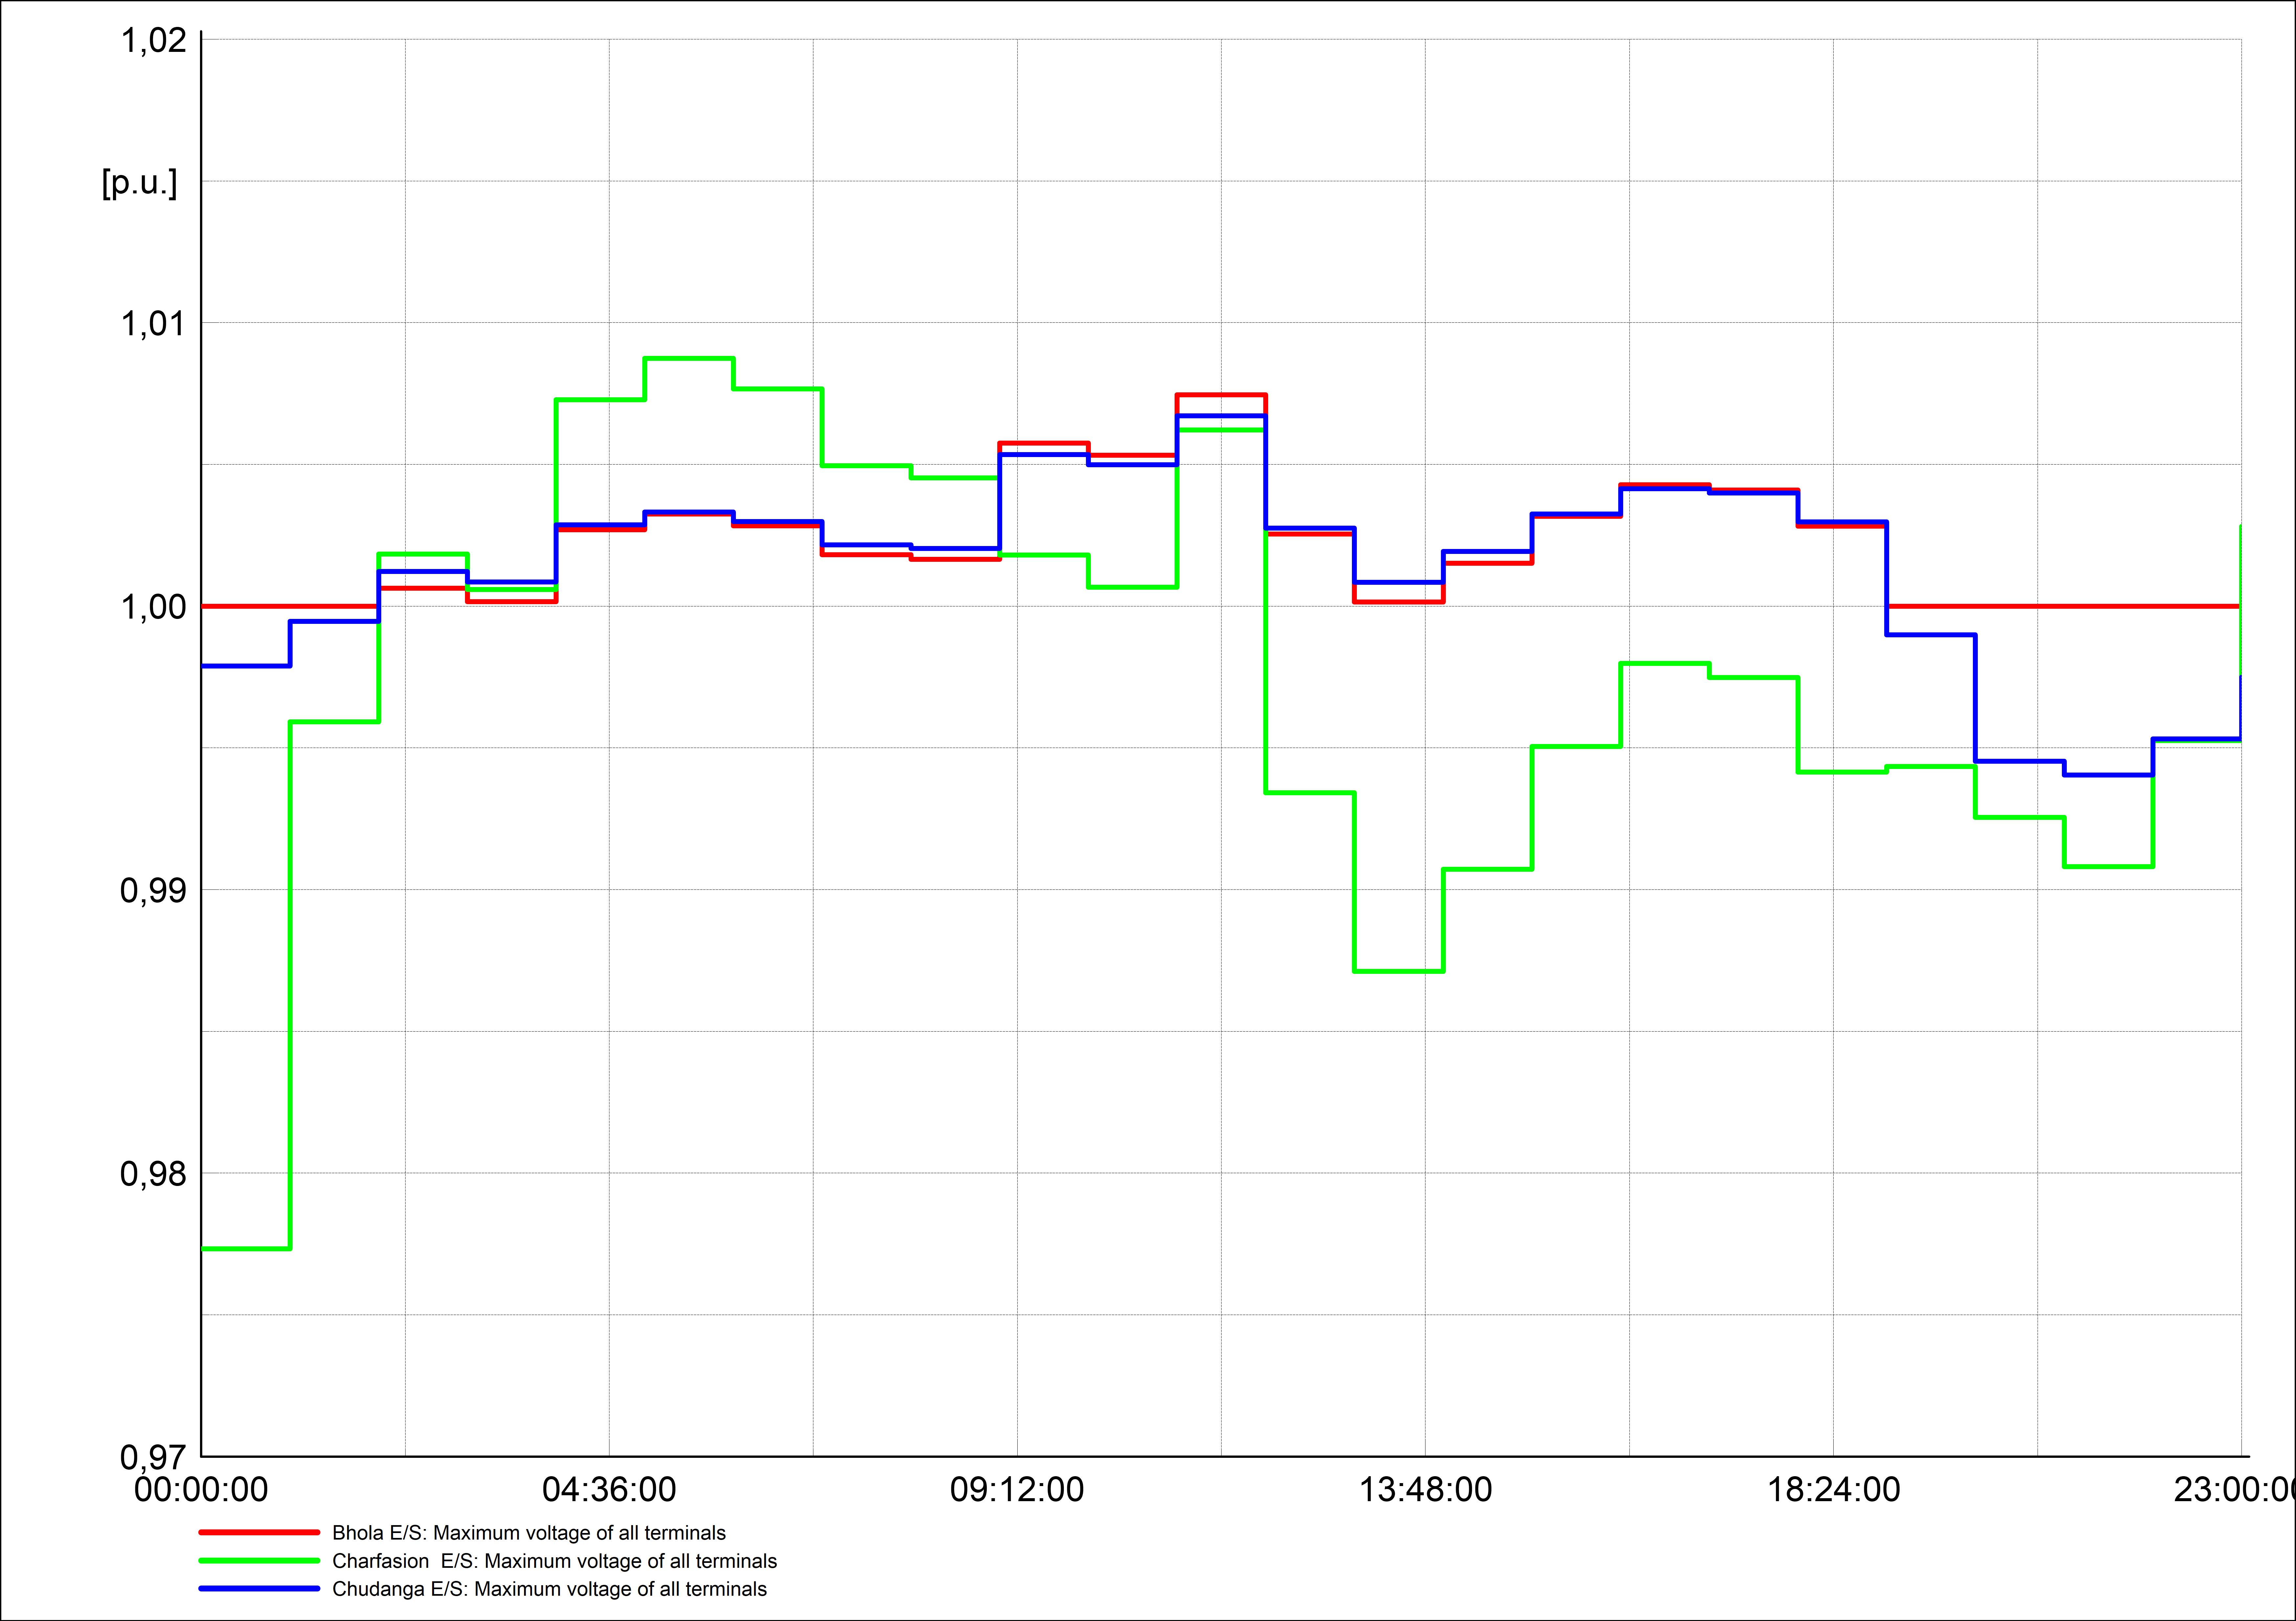
We also introduced quasi-dynamic analysis to assess voltage profiles, active and reactive power balance, energy losses and to verify the load curve trends during different seasons of the year. The diagram below shows a voltage profile during the different hours of the day.
What did we discover?
The study led to several important insights for Khulna to improve its electrical distribution systems with Smart Grids. We discovered specific ways that Khulna could:
- Reduce energy losses
- Reduce maintenance costs
- Reduce PFC charges
- Reduce energy not served
- Reduce CO2 emissions
- Reduce operations costs
- Reduced outage incidents and duration
We are especially positive about the benefits below.
| Benefit | Value |
| Reduce CO2 emissions | 492,250 tCO2/p.a. |
| Increase power supply capacity | 27% of actual capacity |
| Reduce power losses | 1,03% of total system load (1) |
(1) Calculated at peak load for the year 2022
From challenge to opportunity
This study provides strong support for Smart Grids in Bangladesh and it may represent a good example for other developing countries to help transform fundamental energy challenges into extraordinary opportunities.
It exemplifies the breakthrough results Tractebel produces by combining the very best technical expertise and the latest digital tools alongside local partners. With Smart Grids, Tractebel is helping to change the way Bangladesh and the world uses energy.
To be continued…
Luca’s relationships with his Bangladeshi partners were key to the success of this project. Learn more about his experience next time.